


Wow, it has been a crazy year and a half for Baldwin real estate but it looks like things are beginning to level out. Check out this extensive report for the month of July 2022 to see the real numbers. The August report should be out next week.
If you’re interested in the real estate market of Baldwin County (whether buying or selling a home or condo), I think you’ll find this page very useful. This is the most comprehensive page on real estate market data that you’ll find in the area.
Keep reading below and please let me know if you have any questions about our area and/or real estate conditions.
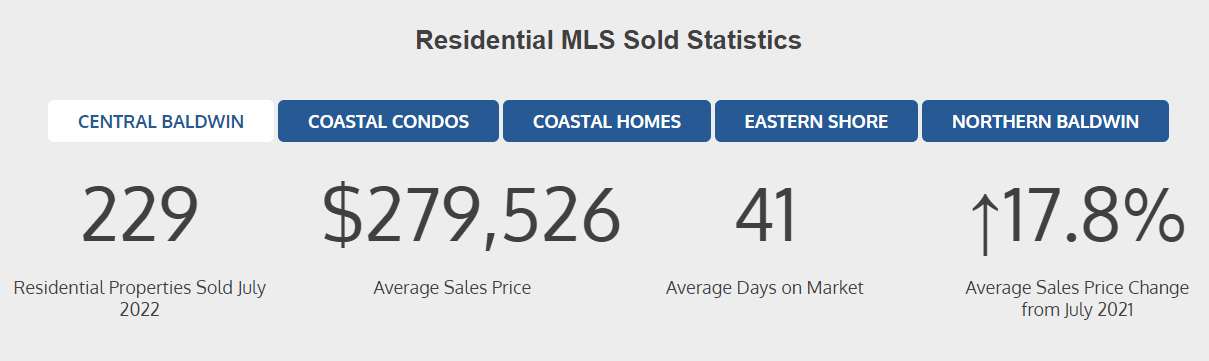
Baldwin Real Estate Data for July 2022

Find Much More Real Estate Stats for Baldwin County Following the Infographic

ORANGE BEACH REAL ESTATE
Single Family Homes
- 22 homes were sold
- Average list price – $973,613
- Average selling price – $953,376
- Selling to listing ratio – 97%
- Average days on the market – 55
- Price per square foot – $388
- Average square feet of homes sold – 2,300
Condos
- 62 condos were sold
- Average list price – $786,196
- Average selling price – $762,254
- Selling to listing ratio – 97%
- Average days on the market – 26
- Price per square foot – $539
- Average square feet of condos sold – 1,412
GULF SHORES REAL ESTATE
Single Family Homes
- 69 homes were sold
- Average list price – $569,503
- Average selling price – $559,735
- Selling to listing ratio – 99%
- Average days on the market – 34
- Price per square foot – $281
- Average square feet of homes sold – 2,055
Condos
- 50 condos were sold
- Average list price – $505,170
- Average selling price – $492,392
- Selling to listing ratio – 98%
- Average days on the market – 21
- Price per square foot – $485
- Average square feet of condos sold – 1,038
FOLEY REAL ESTATE
- 88 homes were sold
- Average list price – $313,598
- Average selling price – $309,561
- Selling to listing ratio – 98%
- Average days on the market – 34
- Price per square foot – $172
- Average square feet of homes sold – 1,867
FAIRHOPE REAL ESTATE
- 94 homes were sold
- Average list price – $686,353
- Average selling price – $662,068
- Selling to listing ratio – 98%
- Average days on the market – 34
- Price per square foot – $247
- Average square feet of homes sold – 2,496
DAPHNE REAL ESTATE
- 111 homes were sold
- Average list price – $386,561
- Average selling price – $382,929
- Selling to listing ratio – 99%
- Average days on the market – 13
- Price per square foot – $165
- Average square feet of homes sold – 2,300
SPANISH FORT REAL ESTATE
- 44 homes were sold
- Average list price – $384,714
- Average selling price – $382,401
- Selling to listing ratio – 99%
- Average days on the market – 25
- Price per square foot – $162
- Average square feet of homes sold – 2,361
So right in the middle of summer and tourist season there were 540 homes and condos sold in the month of July. Also, this doesn’t include land sales or commercial properties. As you can see with this listing to selling price ratio at 98%, the demand for real estate in the whole county has been strong this year. Although buyers are seeing an average of 2% off of the sales price, there are many properties that are being sold at asking price or over asking price. Buyers need to be prepared mentally for this fact.
With nearly 18 closings every day of the month in July, I would say that Baldwin is still doing quite well, despite the big price increases over the last year and a half. I am, however, seeing pricing leveling out and dropping in some cases.
Recap based on July statistics:
- If you’re thinking about buying a condo at the beach, Gulf Shores is cheaper than Orange Beach but you also have to take into account that Gulf Shores condos tend to be a little smaller.
- Do you want a single family home near the beach? Foley is priced $216 less per foot than Orange Beach and $109 per foot less than Gulf Shores (for single family homes).
- For single family homes on the Eastern Shore, Spanish Fort homes are the least expensive selling at $162 per foot, followed by Daphne at $165, and then by Fairhope at $247 per foot.
This recap only represents the major cities of Baldwin County and not the smaller towns like Loxley and Summerdale.
Contact me for any real estate information that you need.
Click here to use this interactive stat maker. Click then scroll down.

ORANGE BEACH REAL ESTATE
Single family homes
- 153 homes for sale
- Median list price – $799,000
- Median price per square foot – $426
- Average days on the market – 83
- Median house size – 2,310
Condos
- 267 condos for sale
- Average list price – $915,816
- Average price per square foot – $599
- Average days on the market – 79
- Median condo size – 1,495 square feet
GULF SHORES REAL ESTATE
Single family homes
- 222 homes for sale
- Median list price – $779,950
- Median price per square foot – $405
- Average days on the market – 81
- Median house size – 2,033 square feet
Condos
- 267 condos for sale
- Average list price – $599,088
- Average price per square foot – $472
- Average days on the market – 69
- Median condo size – 1,308 square feet
FOLEY REAL ESTATE
- 214 homes for sale
- Average list price – $390,690
- Average price per square foot – $194
- Average days on the market – 71
- Median house size – 2,080 square feet
FAIRHOPE REAL ESTATE
- 158 homes for sale
- Median list price – $539,950
- Median price per square foot – $217
- Average days on the market – 67
- Median house size – 2,353 square feet
DAPHNE REAL ESTATE
- 133 homes for sale
- Median list price – $391,220
- Median price per square foot – $169
- Average days on the market – 56
- Median house size – 2,409 square feet
SPANISH FORT REAL ESTATE
- 55 homes for sale
- Median list price – $394,900
- Median price per square foot – $166
- Average days on the market – 40
- Median house size – 2,314 square feet
For additional information about any real estate in Baldwin County, please call, text, or email me at:
Jeff Nelson
IXL Real Estate Eastern Shore
251-654-2523
jeff@livegulfshoreslocal.com
